

Slip and Slide
Powell says "unusually uncertain." Markets say "hold my beer."

This was the week the Federal Reserve tried to thread a needle while the world was on fire. The FOMC held rates steady, the dot plot projected just one cut for the rest of the year, producer prices came in hot, durable goods orders disappointed, and oil remained near triple digits as the Iran war grinds into its fourth week. The S&P 500 broke below its 200-day moving average for the first time in 214 sessions and posted its worst weekly loss in five months. There’s a lot to unpack. Let’s get into it.
The Fed Holds Steady — But the Dot Plot Tells the Real Story
The FOMC voted 11-1 on Wednesday to keep the federal funds rate at 3.50–3.75%. The decision itself was widely expected. What mattered was the updated Summary of Economic Projections and, in particular, the dot plot.

The median dot for 2026 landed at 3.4%, unchanged from December, implying just one 25-basis-point cut for the remainder of the year. But the distribution underneath that median is where the tension lives. Seven members see rates staying right where they are through year-end. Seven see a single cut. Five see more than one. That’s a committee that doesn’t agree on much besides the fact that right now isn’t the time to move.
The bottom line: the Fed is trapped between an inflation outlook that’s getting worse and an economy that may need help sooner than the committee is willing to provide it. The upside risks to inflation are real with oil spiking above $90. But so is the downside risk to growth. Powell called the current environment “unusually uncertain” during the press conference, which is Fed-speak for “we’re making this up as we go.”
PPI: Producer Prices Surge
Wednesday’s Producer Price Index for February was ugly. The headline number rose 0.7% month-over-month, well above the 0.4% consensus, following gains of 0.5% in January and 0.4% in December. On an unadjusted basis, the index for final demand rose 3.4% year-over-year, the largest 12-month advance since February 2025.

Core PPI — the index for final demand less foods, energy, and trade services — rose 0.5% for the month and 3.5% year-over-year, the tenth consecutive monthly advance. For anyone hoping the PPI would feed through to a friendly PCE print, this report was a cold shower. The pipeline pressures are building, not fading, and the war in the Gulf is adding fuel — literally — to a fire that was already burning.
Oil and the Iran War: The Trap Tightens
I wrote last week ago about the multiple traps facing markets (Trapped!) — the inflation trap, the oil trap, the policy trap. This week, those traps got tighter.
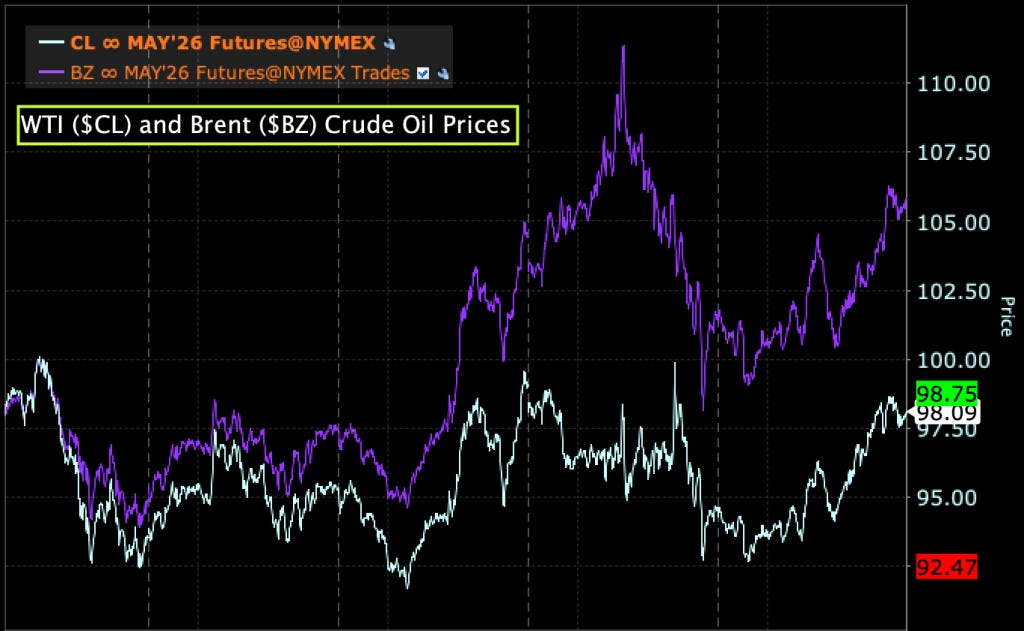
WTI crude traded near $98 this week, with Brent spiking to $109. The Strait of Hormuz remains effectively closed to Western-flagged vessels, though tanker tracking data shows Iran is selectively allowing some commercial ships through. The number of vessels transiting has roughly doubled from the worst days of the blockade, but that’s still a fraction of normal traffic.
Stocks and Interest Rates: A Technical Breakdown
The weekly chart of the S&P 500 tells a sobering story. The index closed Friday at 6,595, slicing below the 50-week simple moving average since the April 2025 correction. The broader structure is worth studying. The rally from the 2022 lows to the February 2025 top was one of the most powerful bull runs in modern market history. The Fibonacci extension resistance at 6,975 — derived from the 2022 and 2025 corrections — marked the ceiling almost to the tick. The market kissed that level, failed, and has been grinding lower ever since. We’re now roughly 6% off the highs, and the character of the decline is changing. What started as an orderly pullback is beginning to look more like a trend change.

The technical indicators confirm the deterioration. RSI on the weekly chart has fallen to roughly 50 — neutral territory, but notably the lowest reading since the April 2025 selloff to 4,836. More importantly, the MACD has crossed over into negative momentum which signals the intermediate-term trend is weakening.
The Nasdaq fared worse on the week, dropping 1.5% on Friday alone. The Dow shed about 0.4% on the day. Year-to-date, the broad market is underwater.
The Yield Curve

The chart above shows how dramatically the yield curve has steepened over recent weeks (thick blue line). The 10-year has surged to roughly 4.35% and the 30-year sits near 4.85%. At the front end, you have a slowing economy and the expectation that the Fed will eventually be forced to cut. At the back end, you have a market demanding significantly more compensation for holding duration in a world of sticky inflation, massive fiscal deficits, a war-driven energy shock, and a higher neutral rate.
For bond investors, the implications are significant. Duration is a double-edged sword right now. The front end offers relative safety and decent carry, but the long end is where the risk — and potentially the reward — lives. If the war ends and oil normalizes, long bonds could rally hard.
Putting It Together
The story this week is the same story it’s been for the last three weeks, just louder. The Fed can’t cut because inflation won’t cooperate. It may need to cut because the economy is slowing. Oil is acting as a tax on consumers and a subsidy to energy producers, creating massive sector dispersion. The war has no clear end in sight. And markets are struggling to price an outcome that nobody can predict.
The dot plot tells you the Fed expects to get inflation back to 2% eventually, but “eventually” doesn’t help you today. The word “stagflation” is being used more often now, and while I don’t think we’re there yet, the direction of travel is uncomfortable.
See you next week with more commentary!
President, Kisco Capital

This commentary is provided by Kisco Capital LLC for informational purposes only and does not constitute investment advice or a recommendation to buy or sell any security. Opinions are subject to change without notice. Past performance is not indicative of future results. All investments involve risk, including possible loss of principal. Kisco Capital and its clients may hold positions in securities discussed herein.