

Year-End Reality Check
Jerome's Final Rate Move?


The Federal Reserve wrapped up its final FOMC meeting of 2025 by cutting the Fed Funds Rate by 25bps to a range of 3.5%-3.75%. With this meeting we also got the quarterly Summary of Economic Projections (SEP) and among the items in this report is the closely watched dot-plot where each member anonymously submits their forward projection of interest rates which you can see below:

The Dot-Plot Shows the Varying Opinions
As you can see there is a wide dispersion in the dots which evidences the Fed is wrestling with the inflation outlook (not going down fast enough) verses labor market concerns (more layoffs on the horizon). The median projection for the federal funds rate came out mostly unchanged from September:
End of 2025: 3.6% (unchanged).
End of 2026: 3.4% (unchanged).
End of 2027: 3.1% (unchanged).
End of 2028: 3.1% (new projection).
Longer-run neutral rate: 3.0%.
Despite the stronger economy and persistent inflation, the Fed is maintaining its gradual easing path until further notice. Below are a few more projections from the Fed in the SEP report:
GDP Growth - Upgraded
2025: 1.7% (up from 1.6% in September).
2026: 2.3% (up from 1.8% in September) - a significant upward revision.
Inflation - Slightly Lower
2025 PCE Inflation: 2.9% (down slightly from 3.0% in September).
2025 Core PCE: 3.0% (down from 3.1%).
2026 PCE: 2.4% (down from 2.6%).
Key takeaway: We’re still well above the Fed’s 2% target, and the path back is slower than hoped.
Labor Market - Holding Steady
Unemployment: 4.5% for 2025, then gradually improving to 4.2% by 2027-2028
The Fed believes it can bring inflation down without significant labor market pain
What’s Notable About This Meeting
1. Growth Optimism: The significant upward revision to 2026 GDP (from 1.8% to 2.3%) suggests the Fed sees the economy in a stronger position than previously thought. This is good news for risk assets and corporate earnings.
2. Inflation Reality: While headline numbers improved slightly, we’re still looking at 2.9% PCE inflation for 2025 - nearly a full percentage point above target. Core inflation at 3.0% reinforces that underlying price pressures remain elevated. However, tariff impacts on prices should show signs of alleviating by the end of Q1 2026 as they are a one-time impact to prices.
3. No Panic, No Pivot: The unchanged dot plot tells us the Fed isn’t panicking about either growth or inflation. They’re sticking to their gradual normalization plan, which suggests confidence in their current trajectory.
4. Wide Dispersion of Views: Looking at the dot plot distribution, there’s significant disagreement among FOMC members about the appropriate policy path - particularly for 2026 and beyond. Some dots cluster around 2.1-2.6% while others remain near 3.9%. This reflects genuine uncertainty about how quickly rates should come down.
Interest Rate Implications for 2026
The Big Picture: The neutral rate appears to have shifted structurally higher - perhaps permanently in the 3% range rather than the pre-pandemic sub-2% levels. For investors, this means we’re likely in a “higher for longer” environment not just for months, but potentially for years.
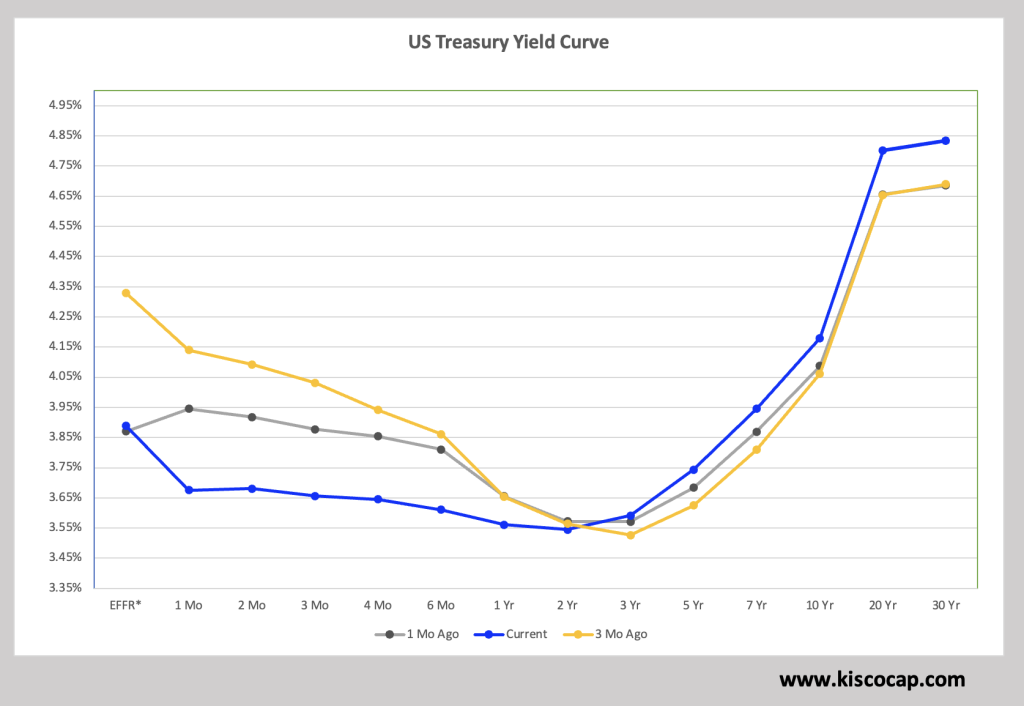
This means that the curve is going to steepen in that scenario as we see the right side of the chart climb higher. In particular, the 2-5Yr tenors look the most vulnerable in the coming months for an adjustment higher.
In the meantime, it looks like the Fed Funds rate will remain unchanged until we get a new Fed Chair in May.
The Stock Market
Below is a chart I share with clients every morning of the S&P 500 futures that includes overnight and pre-market trading. You can see that it has been a rangebound affair with many two-way reversals as the market pauses to consider 2026. On the far right you can see the price swings after the Fed meeting which could continue into Monday. Not a trending chart.

Below is the S&P 500 Index over the past few years and you can see the momentum indicators at the bottom of the chart are close to turning negative which warns the rally from the April low has run out of gas.

Let’s not forget the market leader, NVIDIA and its chart looks like it is about to begin a larger pullback as selling pressure is causing the MACD and RSI at the bottom of the chart to turn lower.

A tumultuous market right now and longer tenor rates may be in the spotlight as growth and inflation still look strong (which is inflationary).
Thank you for being a subscriber!
President, Kisco Capital
